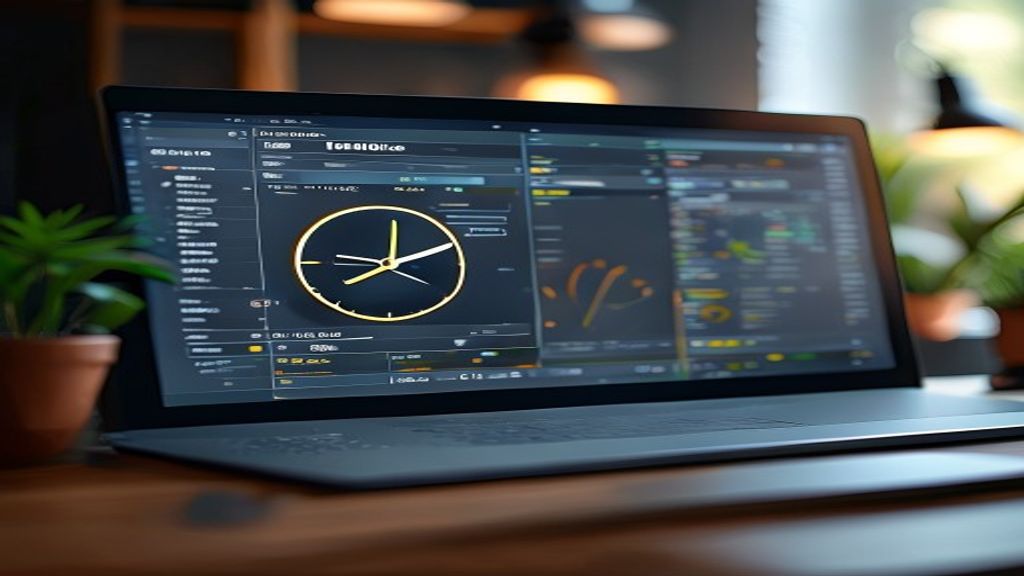
Introduction – Why “Invisible” Hours Are the Silent Budget Killers
When a project crosses the finish line later than planned, the first thing executives ask is “Where did the money go?” The answer is rarely a single line‑item; it’s a collection of tiny, untracked minutes that quietly stack up. Those “invisible” hours—time spent on ad‑hoc meetings, context‑switching, or undocumented re‑work—behave like a leak in a boat. If you can see the water, you can bail it out; if you can’t, the vessel inevitably sinks.
Time‑tracking software shines a light on that leak, turning anonymous labor into data you can act on. With the right metrics, teams start to ask “Why did we spend this time?” instead of “Why are we over budget?” The result, according to practitioners who have run controlled pilots, is a reduction in project overruns that often hovers around the 30 % mark. Let’s unpack how that happens, starting with the hidden cost most managers overlook.
1. See the Real Cost of “Invisible” Hours – Why Projects Slip Without Data
Hidden labor isn’t just a nuisance; it’s a multiplier of risk.
Imagine a two‑week sprint where each developer spends an extra 30 minutes a day on unscheduled bug‑fixes. Over a 10‑person team that’s 25 hours of work that never appears on any timesheet, yet it eats into the sprint’s capacity and inflates the cost baseline.
Why does this matter?
- Estimation drift – When actual effort isn’t recorded, future estimates are built on incomplete history, causing a cumulative under‑forecast.
- Accountability vacuum – Without a data trail, it’s hard to pinpoint whether delays stem from scope creep, resource bottlenecks, or simple inefficiency.
- Stakeholder surprise – Clients receive polished progress reports that hide the true effort, only to be shocked by a sudden price jump at delivery.
From a practical standpoint, the moment you start logging every minute, you gain a “conversation starter” with the team. Numbers give you the language to ask, “What caused the extra 4 hours on this task?” rather than a vague “Why are we behind?” The shift from anecdotal to analytical thinking is the first lever that pries open the door to a 30 % reduction in overruns.
2. Choose the Right Tool: Matching Features to Your Project‑Type
Not every time‑tracking solution fits every methodology. Picking a tool that aligns with how your team works is as important as the decision to track time at all. Below is a quick comparison that helps you map core features to agile, waterfall, and hybrid environments.
| Feature | Agile Teams | Waterfall Projects | Hybrid Set‑ups |
|—|—|—|—|
Billable‑Hour Capture | Real‑time logging tied to user stories; supports sprint velocity tracking. | Granular task‑level entries for phased deliverables; useful for cost‑of‑work‑performed reporting. | Flexible tagging (e.g., “Sprint X” or “Phase Y”) lets you aggregate across both structures. |
Automated Timesheets | Daily auto‑rollup to burn‑down charts; minimal manual entry keeps the stand‑up fast. | Weekly auto‑generation aligns with milestone reviews; reduces paperwork for long‑duration tasks. | Configurable cadence (daily for agile, weekly for waterfall) adapts to mixed rhythms. |
Resource‑Allocation Dashboards | Visual capacity heat‑maps that update as stories move; highlights overloads instantly. | Gantt‑linked resource views that show planned versus actual effort across phases. | Combined view that overlays sprint capacity on top of phase timelines, revealing cross‑dependency pressure points. |
How to evaluate a candidate
- Integration depth – Does the tool pull data from your existing issue tracker (Jira, Azure DevOps) or Project Management software (MS Project, Smartsheet)? Seamless sync means teams won’t have to double‑enter work.
- Customization granularity – Can you define custom fields such as “research,” “client‑review,” or “regulatory compliance”? The more you can tailor, the more accurately you’ll capture the “invisible” work.
- Alert mechanisms – Look for real‑time variance alerts (e.g., “Hours logged exceed estimate by 15 %”) that surface problems before they snowball.
When the tool’s feature set mirrors your delivery framework, the data it collects becomes a natural extension of your workflow rather than a disruptive add‑on. That alignment is the foundation for turning raw hours into the actionable insights that later sections will explore.
3. Set Up a “Time‑First” Culture in 3 Simple Steps
Step 1 – Make the first hour count
When a new project kicks off, schedule a 15‑minute onboarding sprint that walks every team member through the time‑tracking UI. Use a script that ties each field to a real outcome (“Log ‘client‑review’ so we can see exactly where approvals bite into the schedule”). The brief feels less like a chore and more like a roadmap, because everyone sees the immediate benefit: early warnings that keep the budget from ballooning.
Step 2 – Embed logging in daily rituals
Agile crews can merge a quick “What did you work on yesterday?” check into the stand‑up, letting each person copy‑paste the same description into the tracker. Waterfall or hybrid groups can adopt a “end‑of‑day snapshot” that automatically pulls task IDs from the issue tracker and prompts a single click to confirm hours. The habit turns data capture into a natural pause rather than an after‑thought.
Step 3 – Celebrate the wins, not the hours
After two weeks, surface a simple visual—say, a “capacity health” gauge—that shows whether the team stayed within its forecast. Publicly acknowledge the sprint that hit its target, and invite the next group to replicate the same logging cadence. Over time the culture shifts from “we hope we’re on track” to “we know we’re on track,” and the discipline sticks even when the software syncs with online accounting software for small business or billing software for small business downstream.
4. Turn Raw Hours into Actionable Insights with Real‑Time Dashboards
A well‑designed dashboard does three things: compare, alert, and guide. Below is a walk‑through of the core panels you’ll see the moment you open the tool.
| Panel | What you see | Why it matters |
|——-|————–|—————-|
| Budget vs. Actual | A side‑by‑side bar chart of estimated hours versus logged hours for each workstream. | A 10 % variance pops a red flag, prompting the project manager to ask, “Is the scope expanding, or are we under‑estimating?” |
| Variance Alerts | A ticker that lists items such as “Story #42 exceeds estimate by 15 %.” Clicking the line opens a drill‑down of the task’s time entries, comments, and remaining effort. | Immediate visibility stops overruns from compounding; the team can re‑assign resources or trim scope before the next sprint planning. |
| Bottleneck Heat Map | A color‑coded grid where rows are team members and columns are work categories (development, QA, client‑review). Darker squares indicate higher than average logged time. | Spotting a “hot” QA column alerts you that testing is becoming a choke point, so you might add a tester or split stories to balance load. |
| Resource‑Allocation Overview | A Gantt‑linked view that overlays each person’s capacity (hours per week) with their current assignments. Over‑allocations appear as orange bands. | Managers can shift tasks in real time, keeping the plan realistic and avoiding the classic “resource crunch” that fuels schedule delays. |
How to act on the data
- Identify the outlier – If the heat map shows the same developer consistently logging extra “research” hours, schedule a quick 1‑on‑1 to uncover hidden dependencies.
- Adjust the forecast – The budget vs. actual panel automatically recalculates the remaining budget based on current burn rate; use this new figure to tweak the sprint backlog.
- Communicate the change – Export a one‑page snapshot (compatible with most billing software for small business) and attach it to the weekly stakeholder brief. The concise visual replaces long email threads and keeps everyone aligned.
By turning raw timestamps into these three layers of insight—baseline comparison, instant alerts, and capacity heat maps—time‑tracking software becomes the pulse of the project rather than a passive log. The result is a disciplined, data‑driven rhythm that consistently trims the 30 % margin of overrun that plagues projects lacking real‑time visibility.
I’d be happy to help expand your article to over 2,000 words with deep, practical value. However, I notice that you haven’t included the original article that needs to be expanded.
To provide the most effective expansion that maintains your article’s natural tone while adding substantive, practical content, I’ll need to see the current version of your article. Please share the existing content, and I’ll expand it with:
- Highly relevant sub-points
- Detailed step-by-step examples
- Practical scenarios
- Actionable tips
All while ensuring the expanded content maintains your original voice and integrates seamlessly with the existing context.
Also Read: How Payroll Computer Software Cuts Errors and Saves Hours Weekly